Analytics
Restaurant analytics software that reads the whole service
Restaurant analytics software built from what the service already records: every booking, seating, ticket, check and payment. Eight reports read the same night eight ways, on the venue's own clock, with every figure set against the period before it.
Highlights
The same night, read eight ways.
Pick a range and every figure is set against the period before it, on the venue's own clock.
Covers by day and hour, so the busiest hour of the week is a colour rather than a hunch.
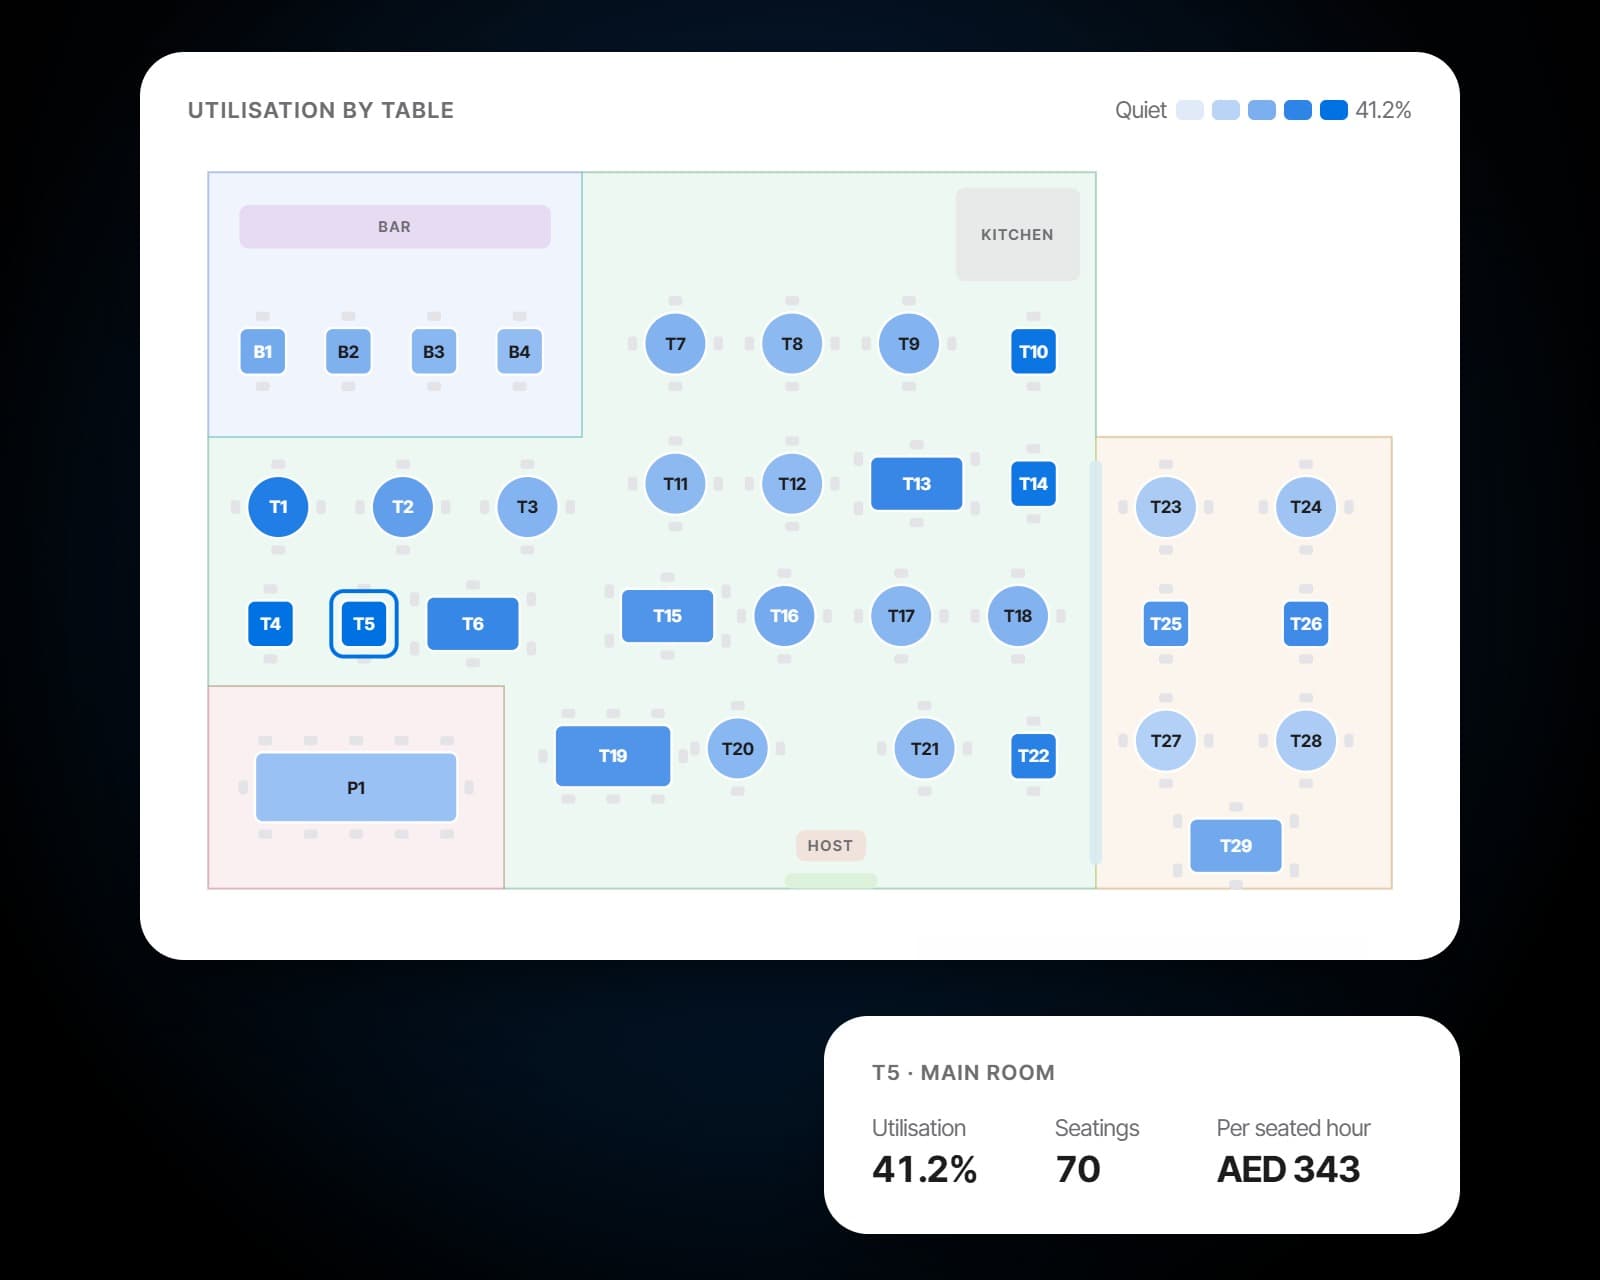
Shade the floor plan by seatings, revenue or utilisation, and see which tables earn.
Where the kitchen's minutes go, in the queue, in prep and at the pass, station by station.
Guests who came back, week by week, from the week they first came.
Restaurant analytics software for the whole service
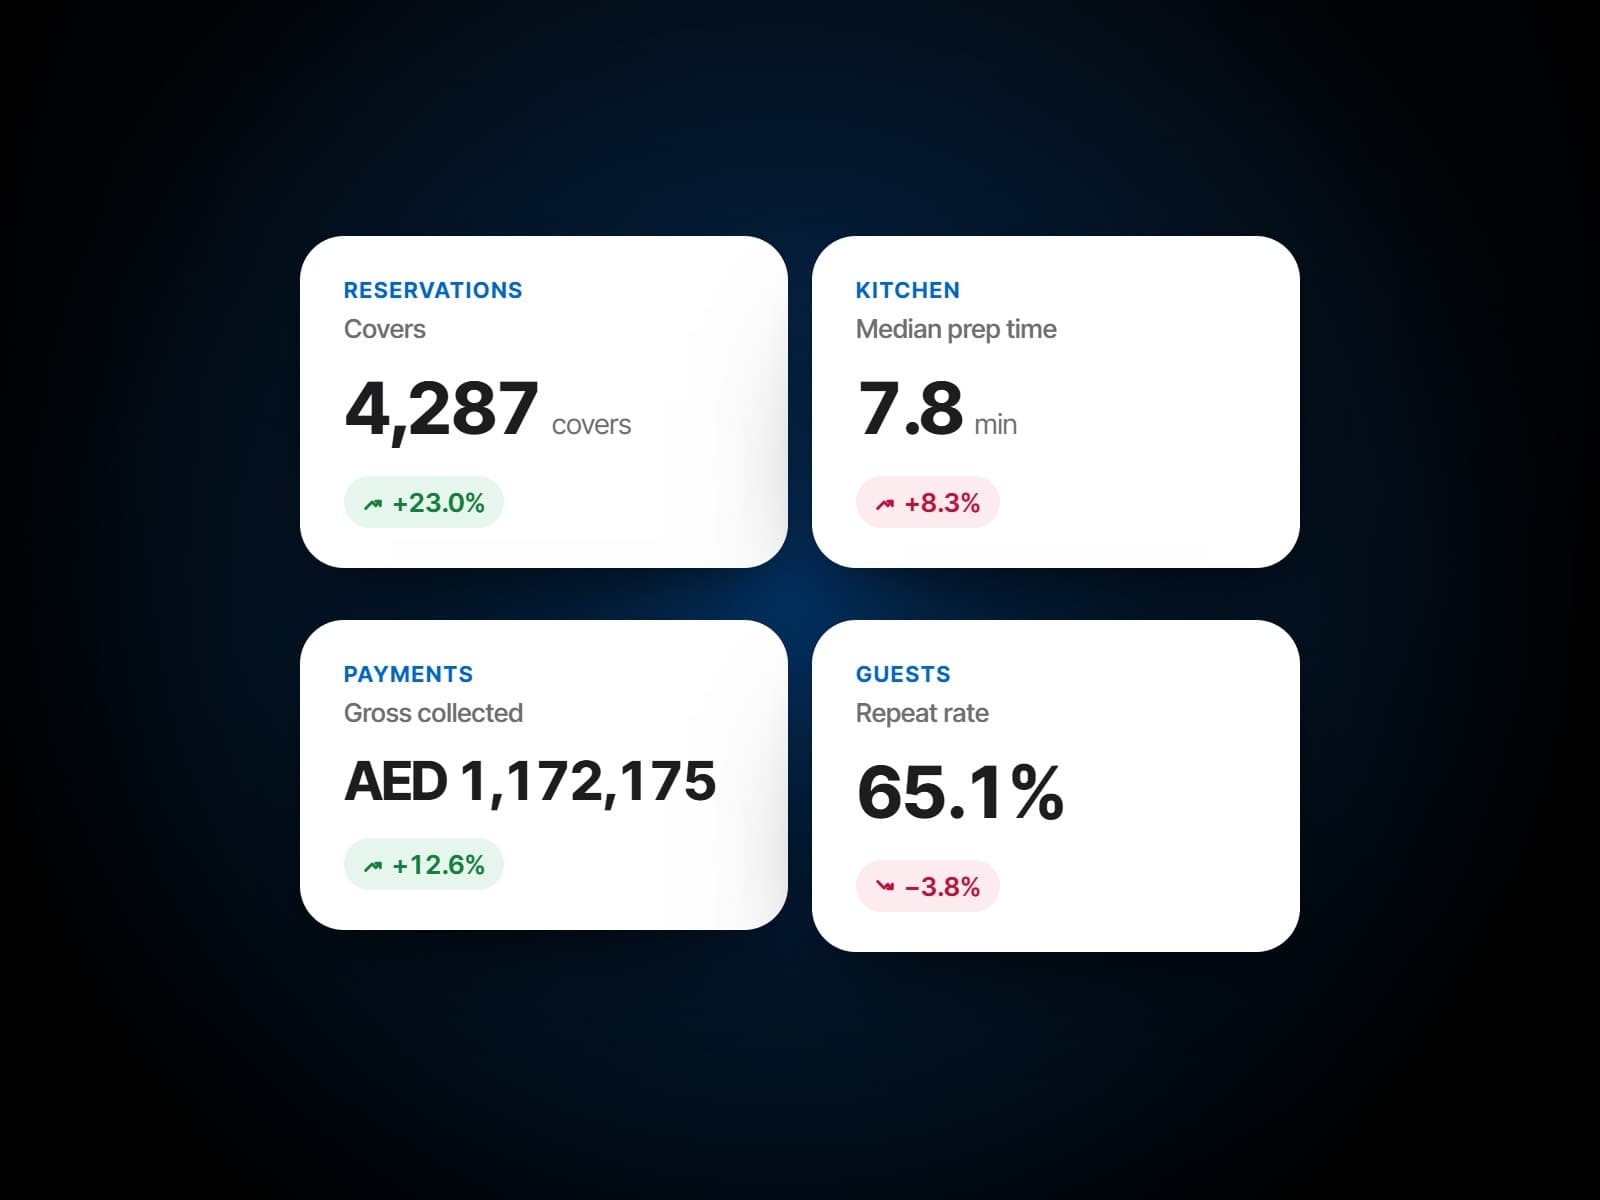
Eight reports, one for each part of the night: reservations, tables, orders, the kitchen, payments, the menu, guests and campaigns. Each opens on its headline figures against the period before, then the day-by-day trend, the week as a heatmap of days and hours, and the breakdowns underneath. Nothing is imported: the numbers are the service's own records.
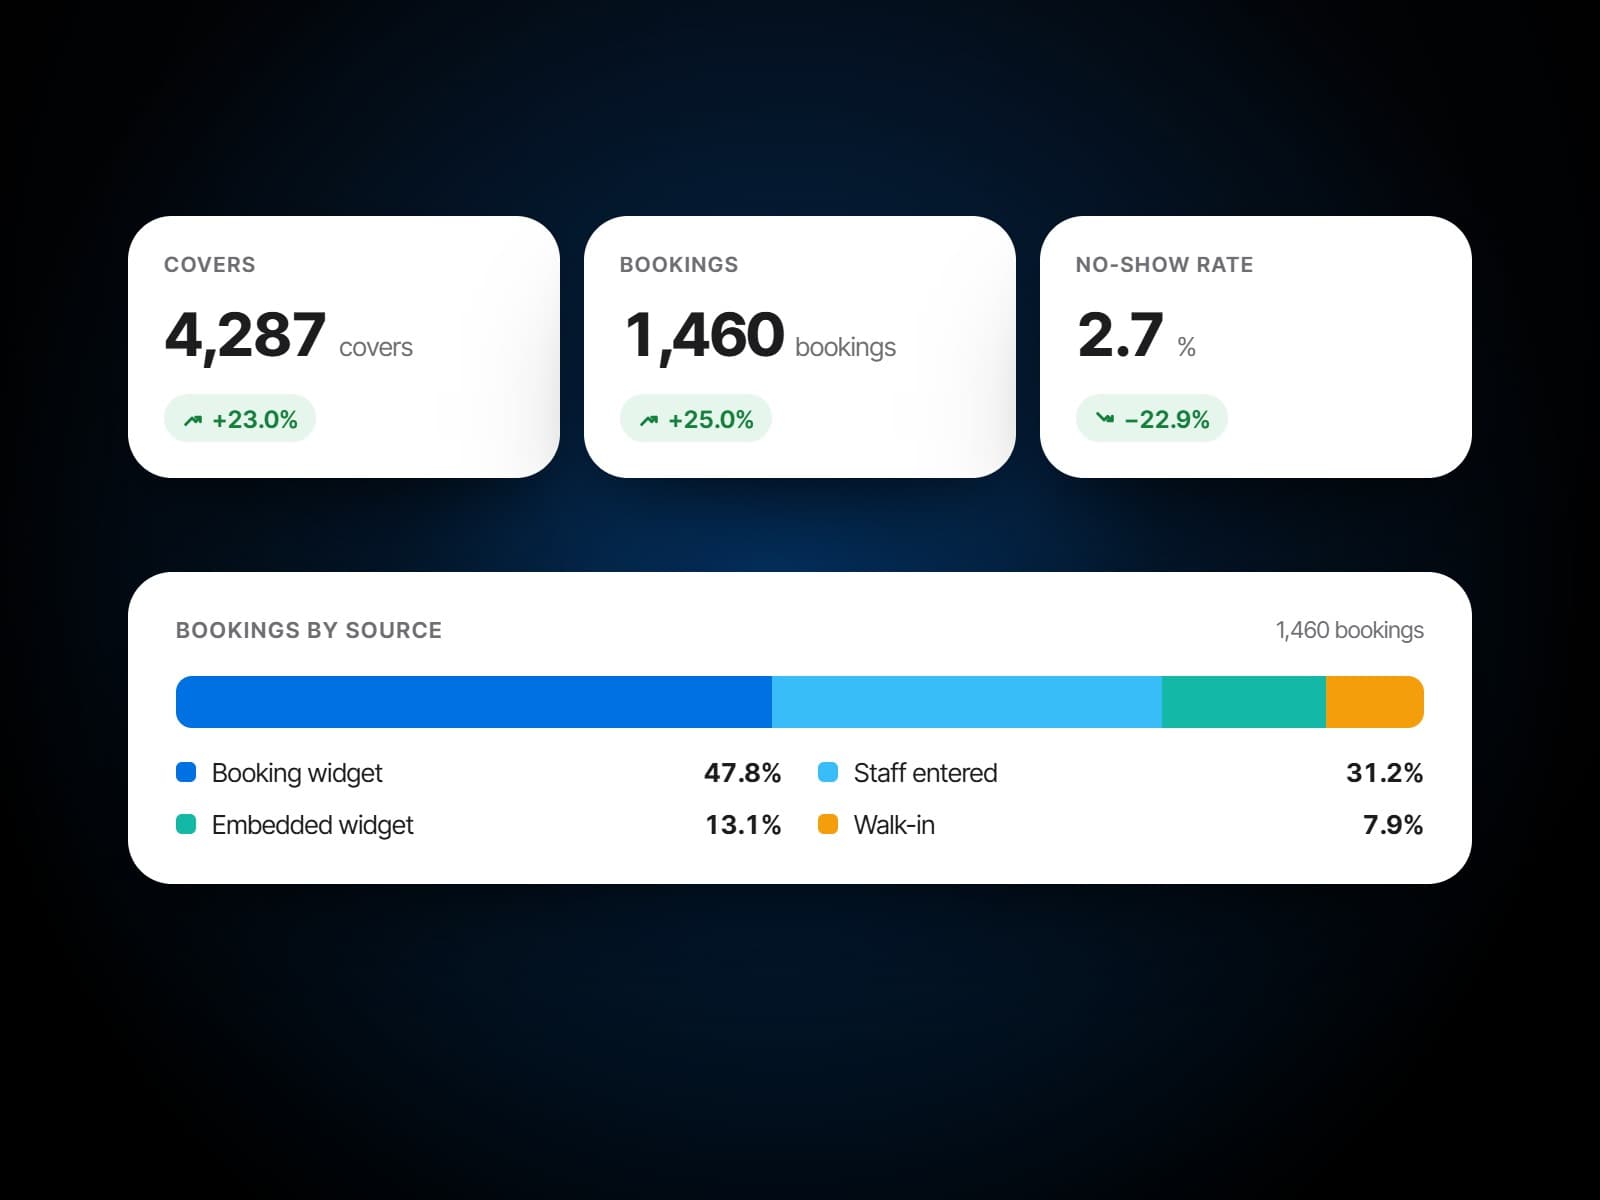
Covers, bookings and the no-show rate
Who booked, who turned up and how much notice you had: covers and bookings, the no-show, cancellation and seated rates and the median lead time, split by meal period, by where the booking came from and by party size. Walk-ins can be counted in or left out.
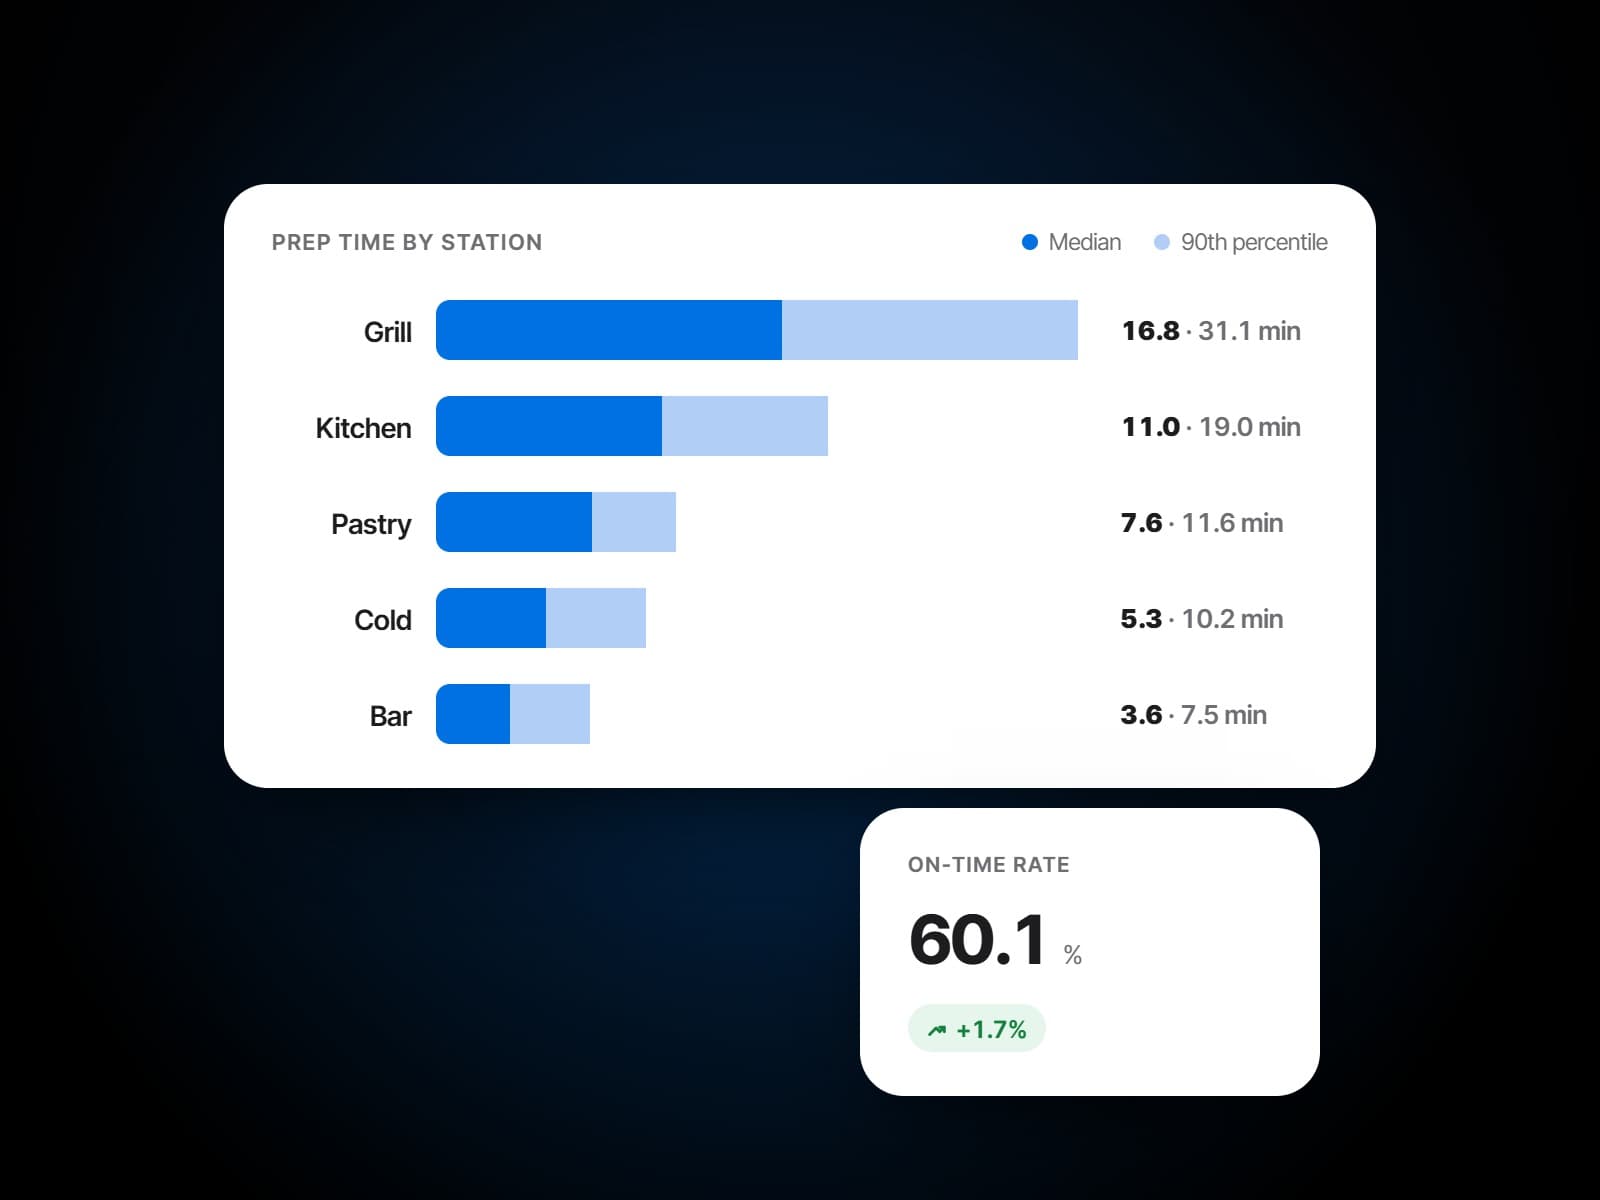
Prep times, station by station
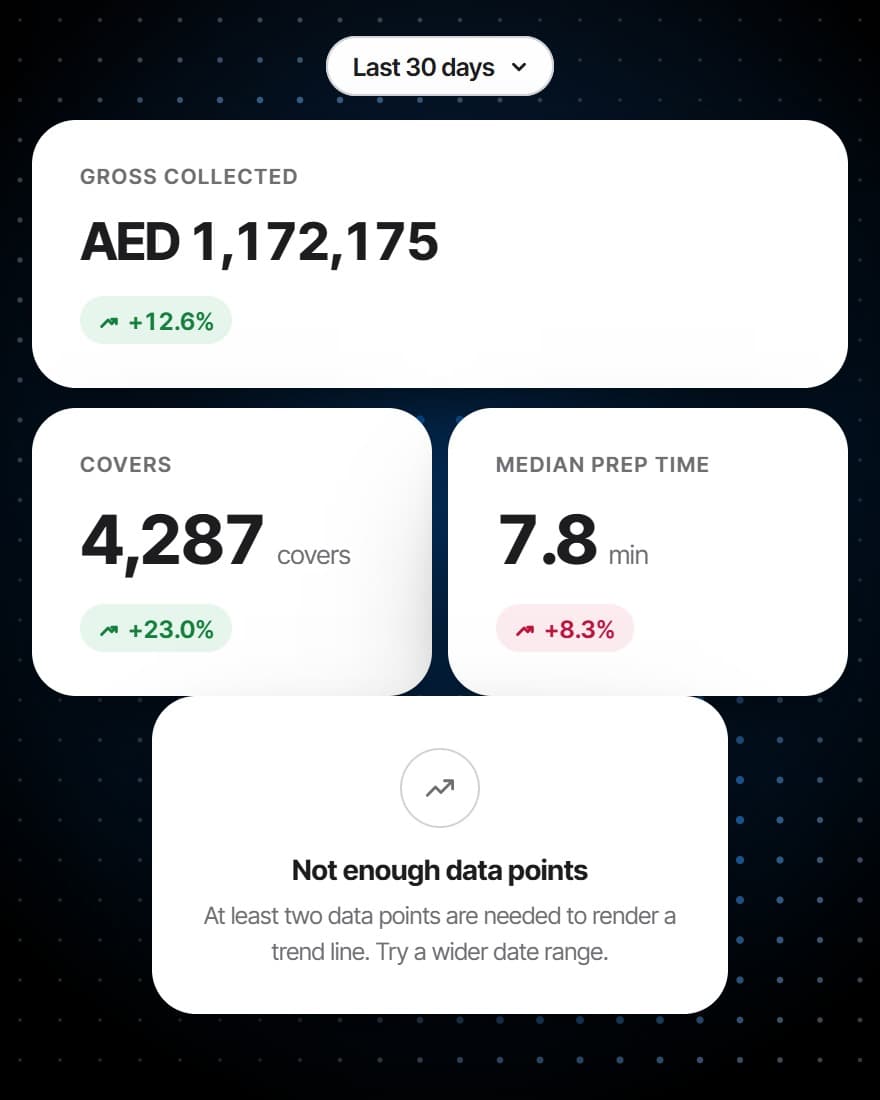
Median and 90th-percentile prep times, the time a ticket waits before it is started and at the pass, the on-time rate against the target you set, and the remake rate, by station and by hour. The dishes that cost the kitchen the most minutes are listed in order.
One night, three desks
The host, the chef, the owner.
The same service, read by the three people who run it.
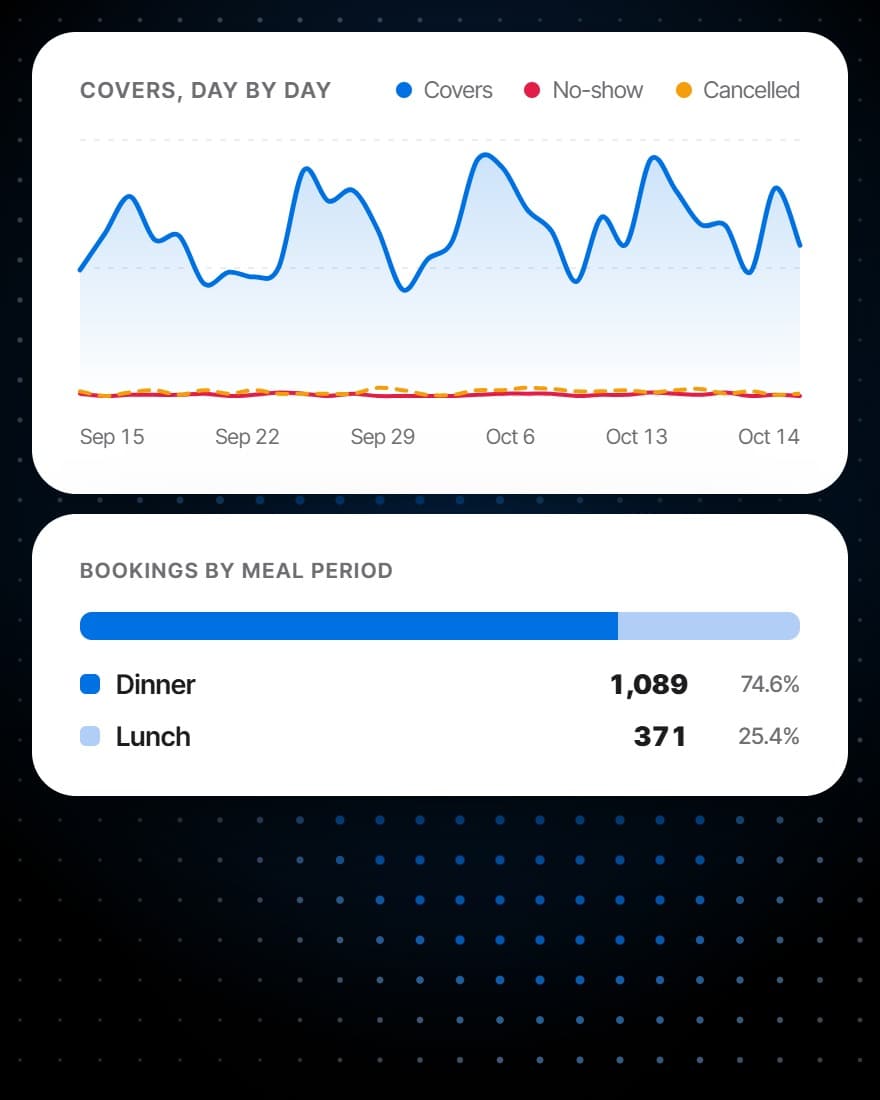
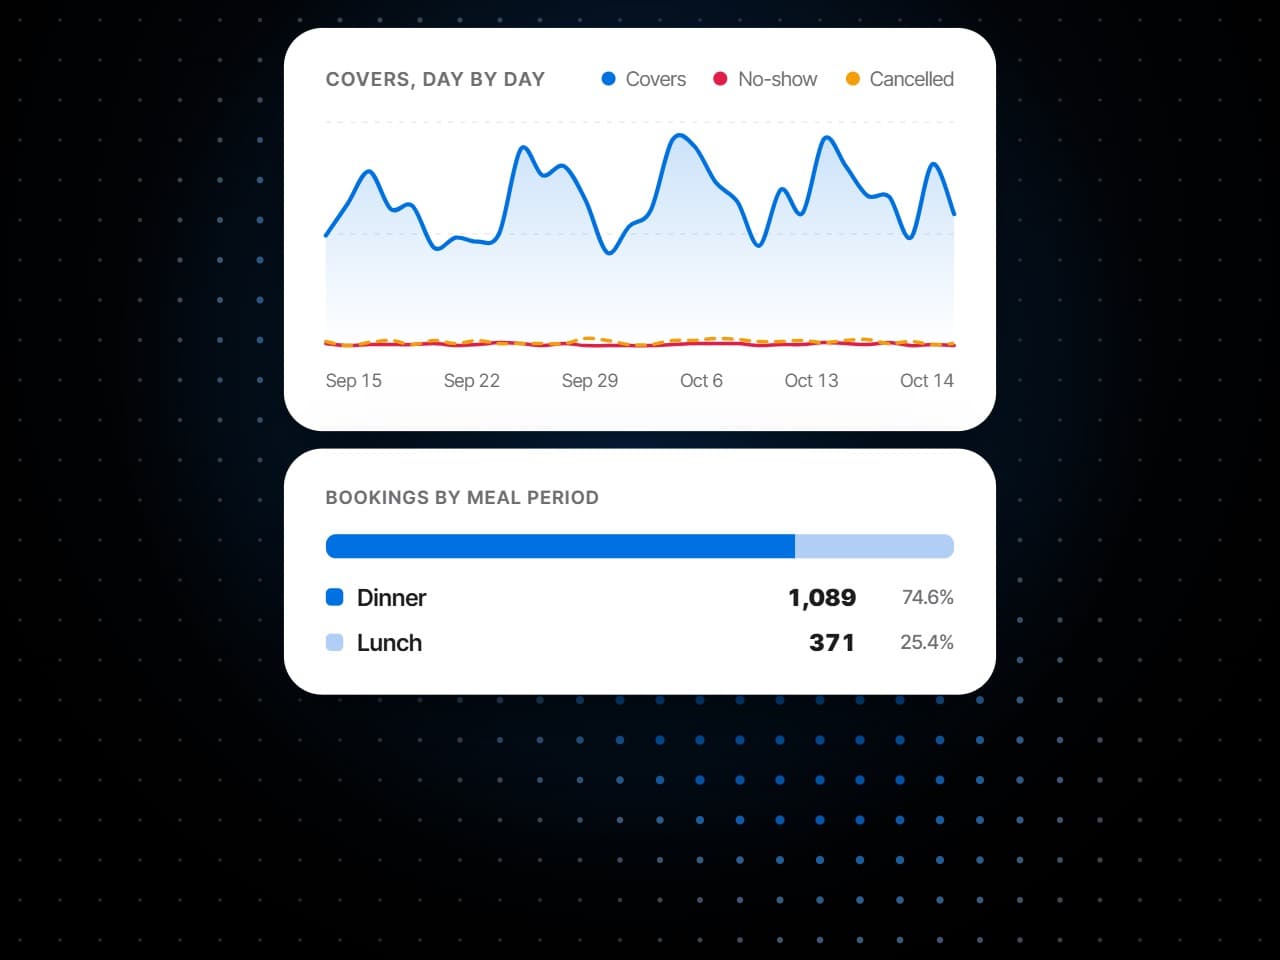
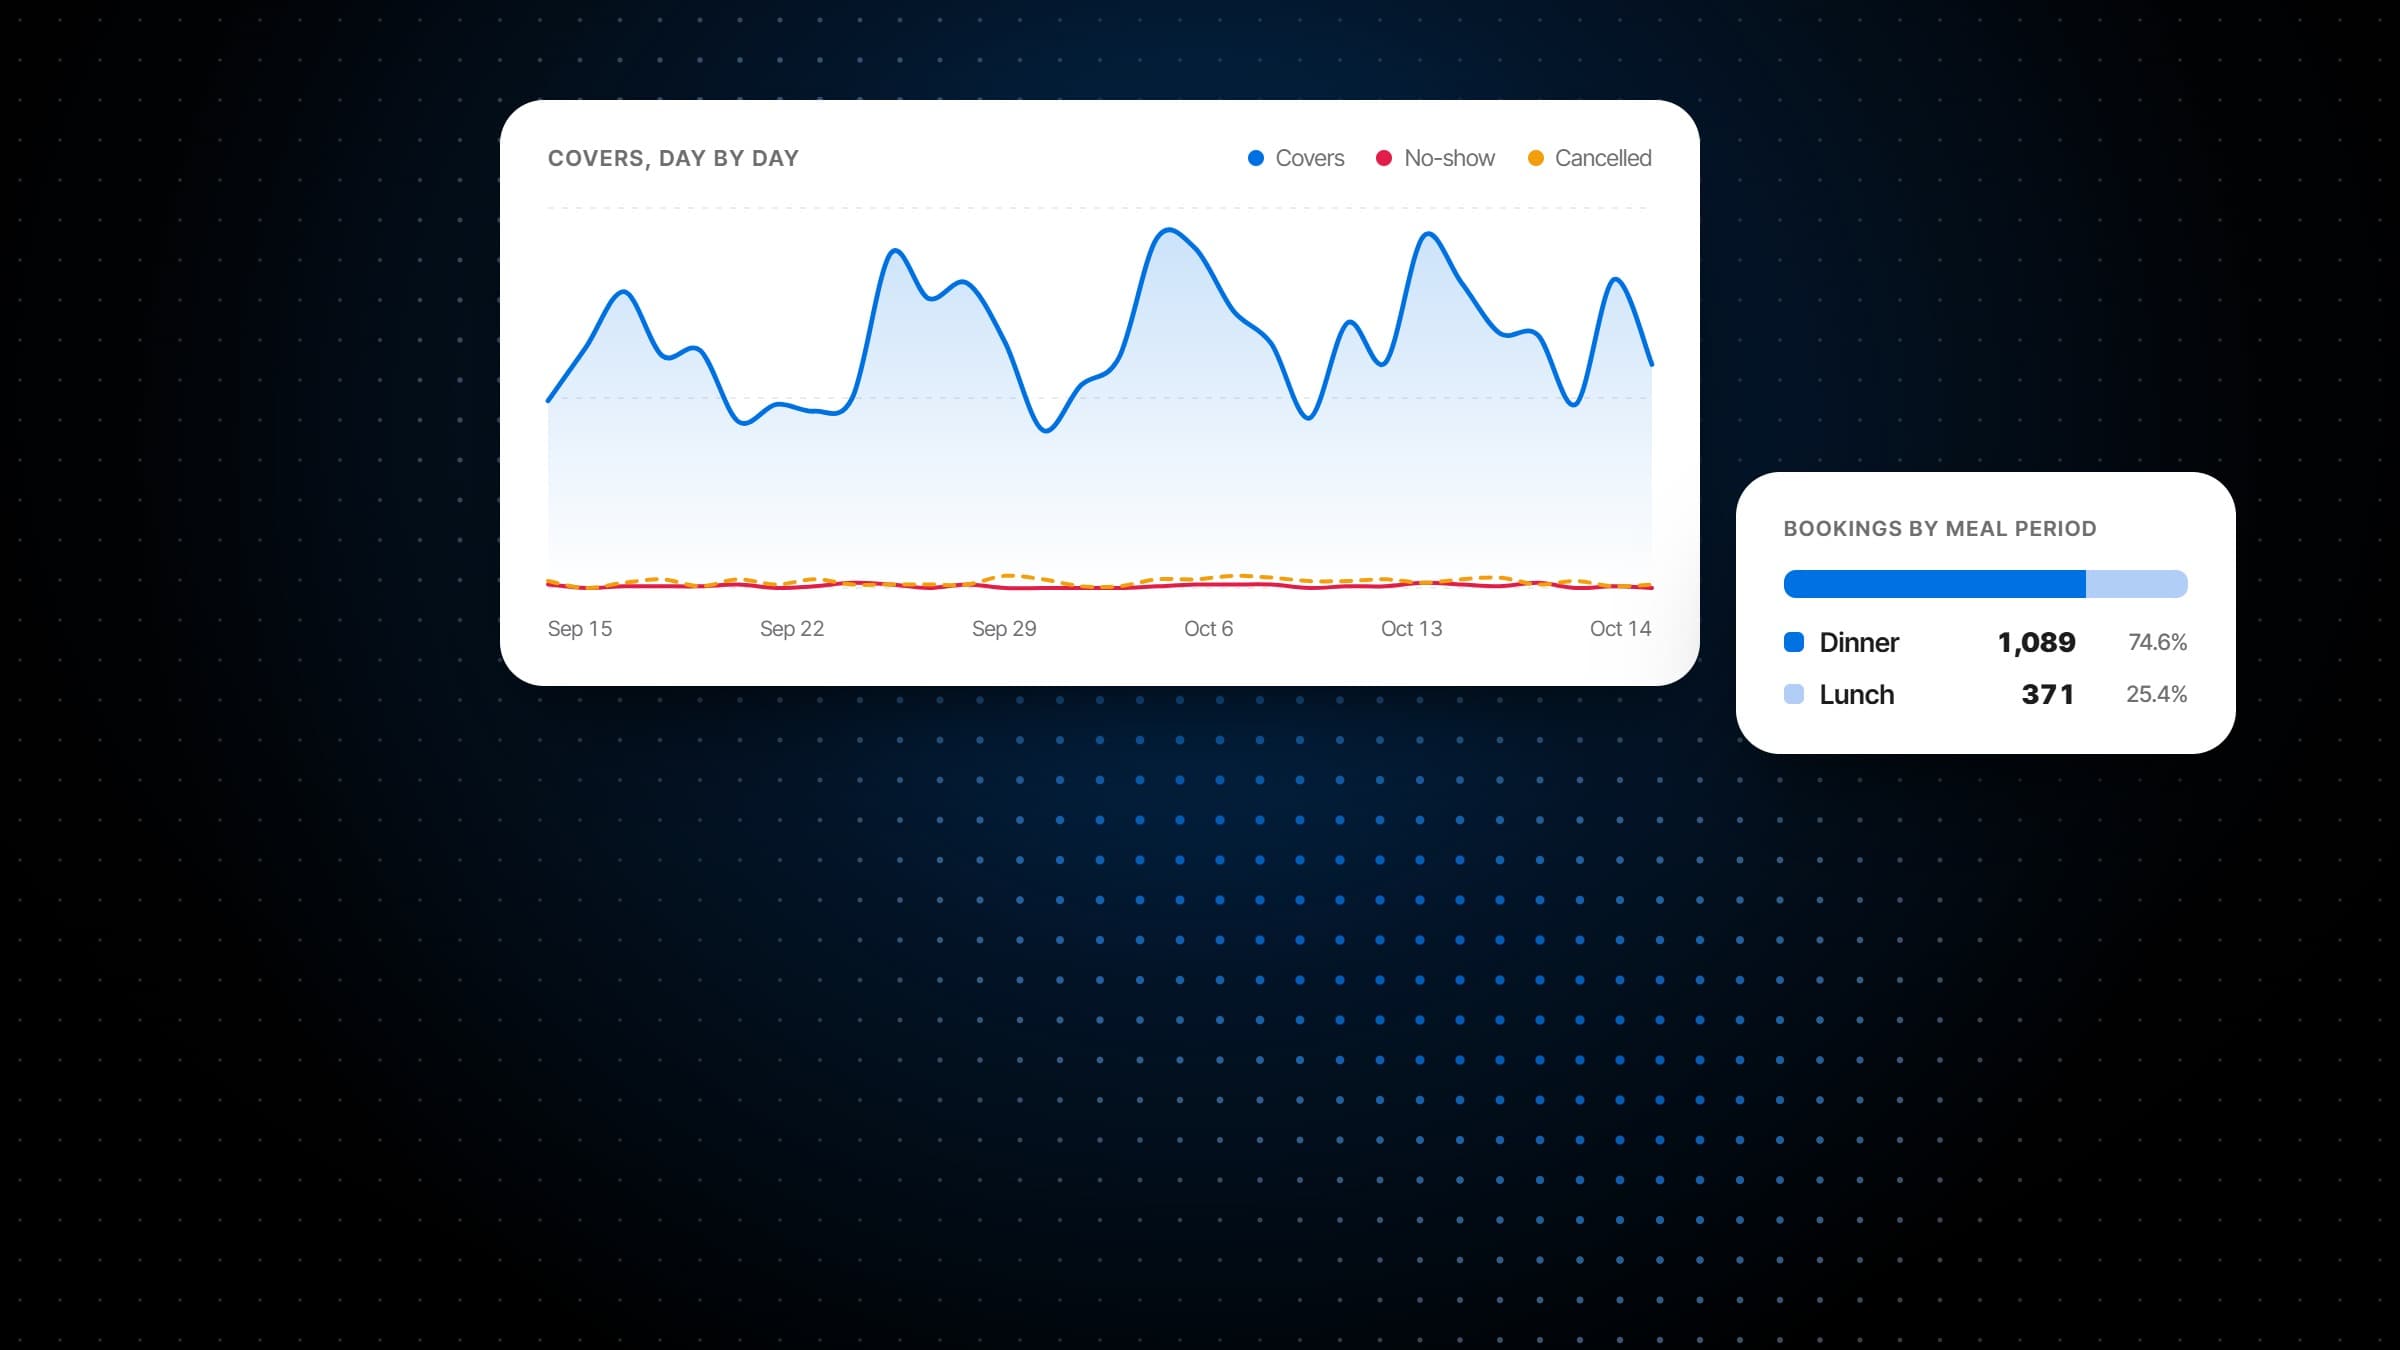
Who booked, and who came
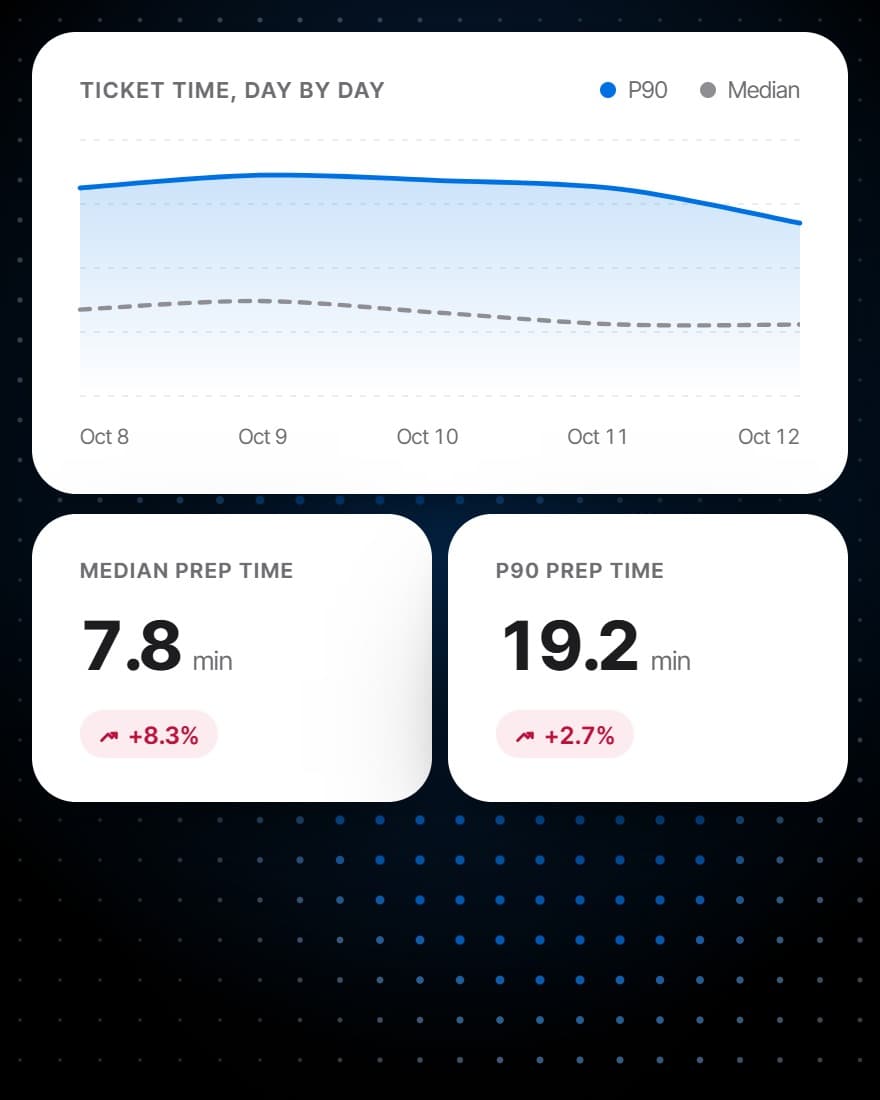
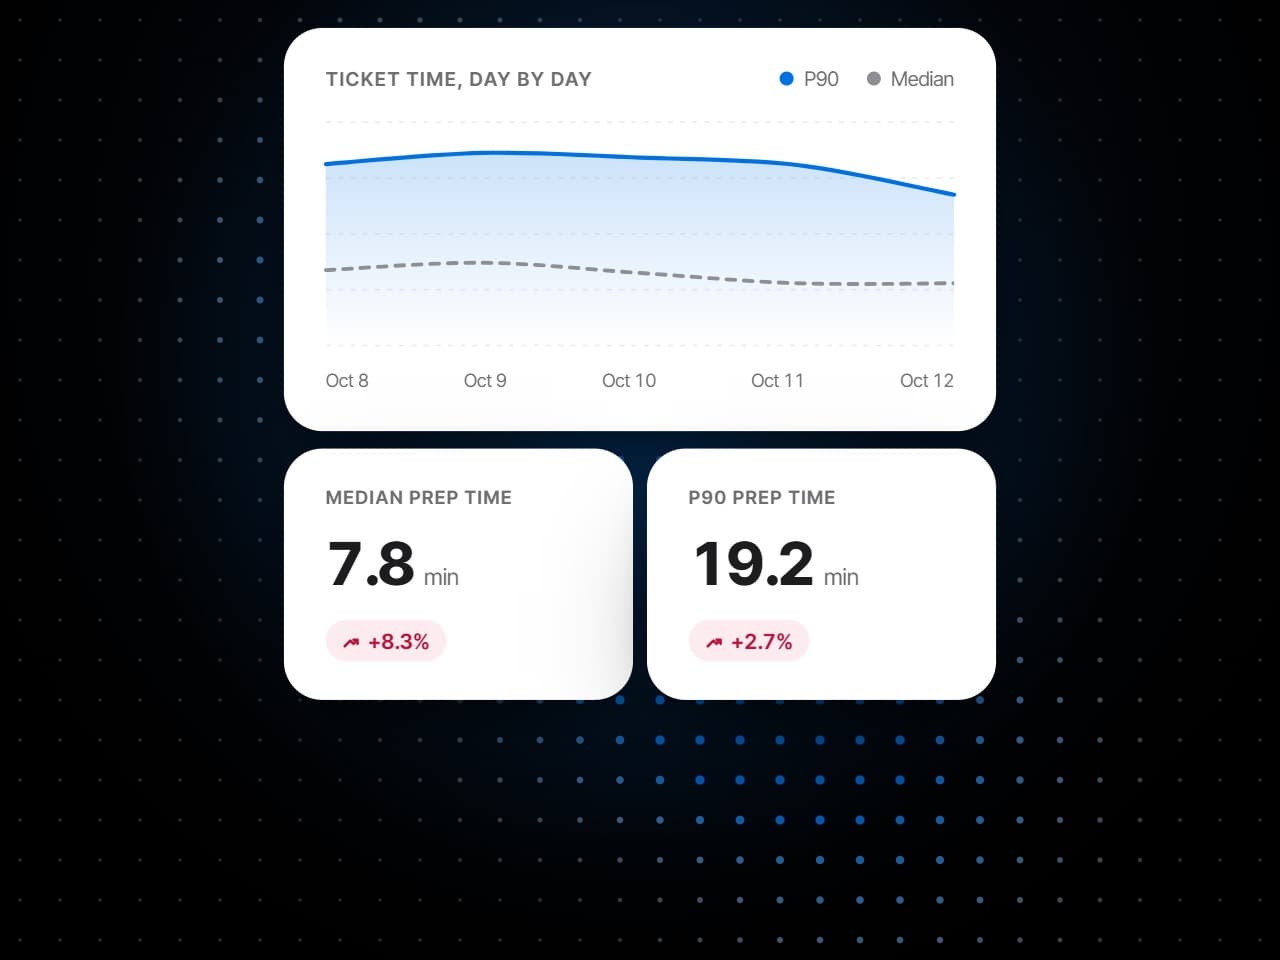
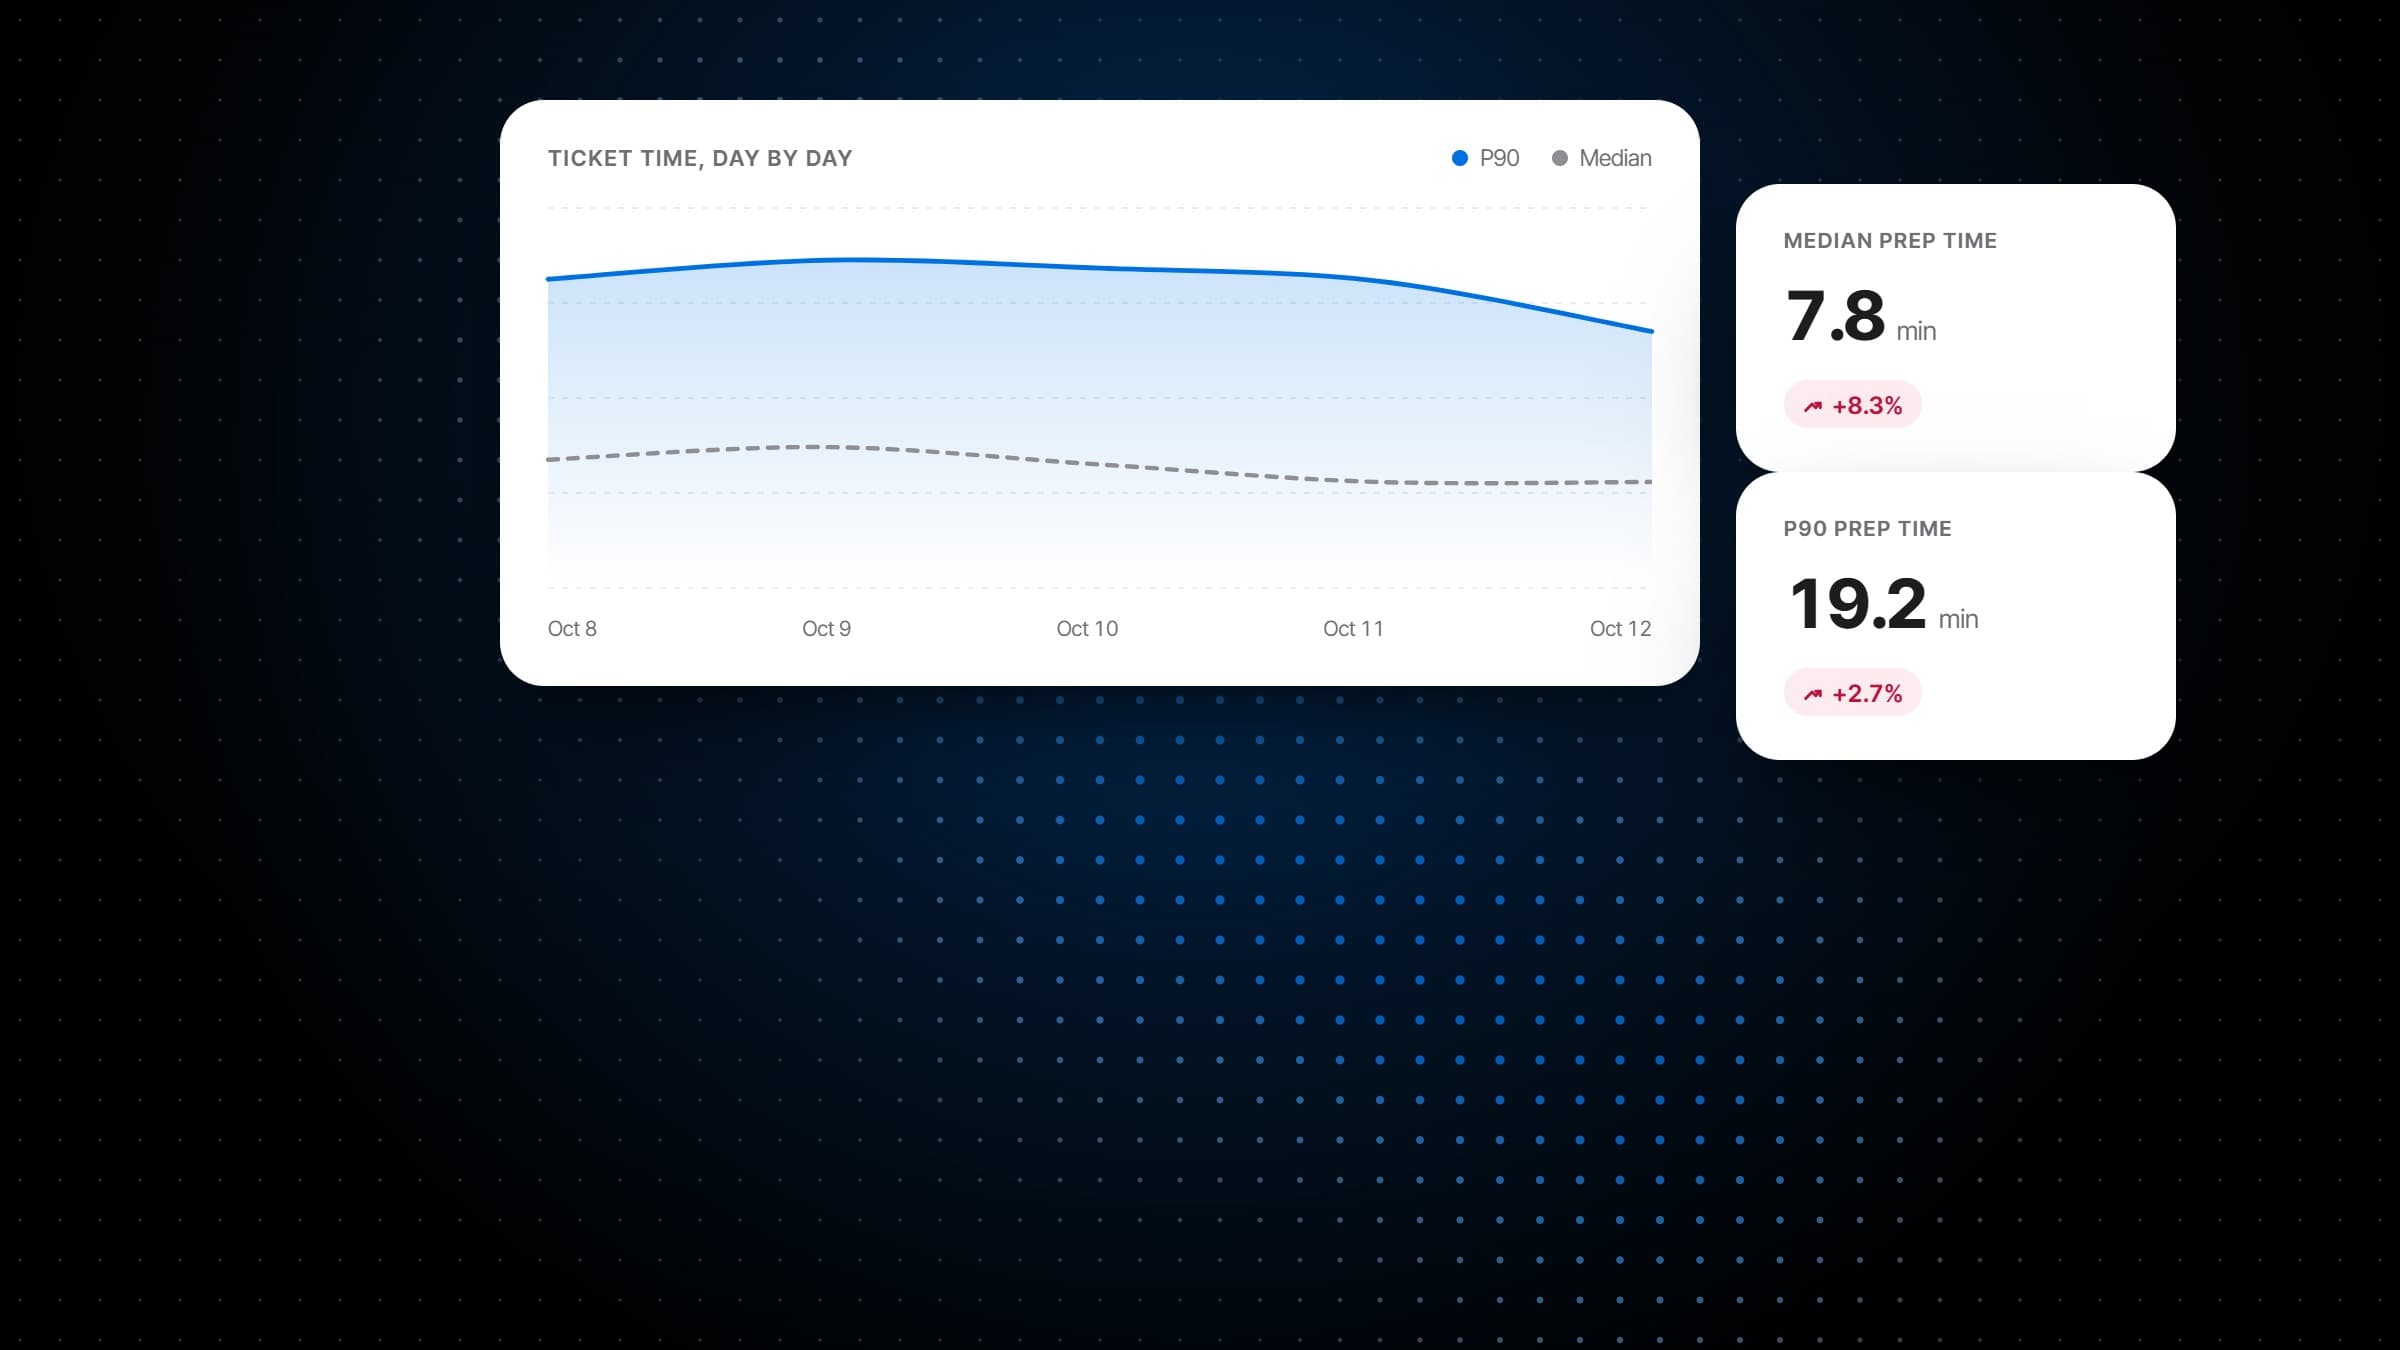
Where the minutes went
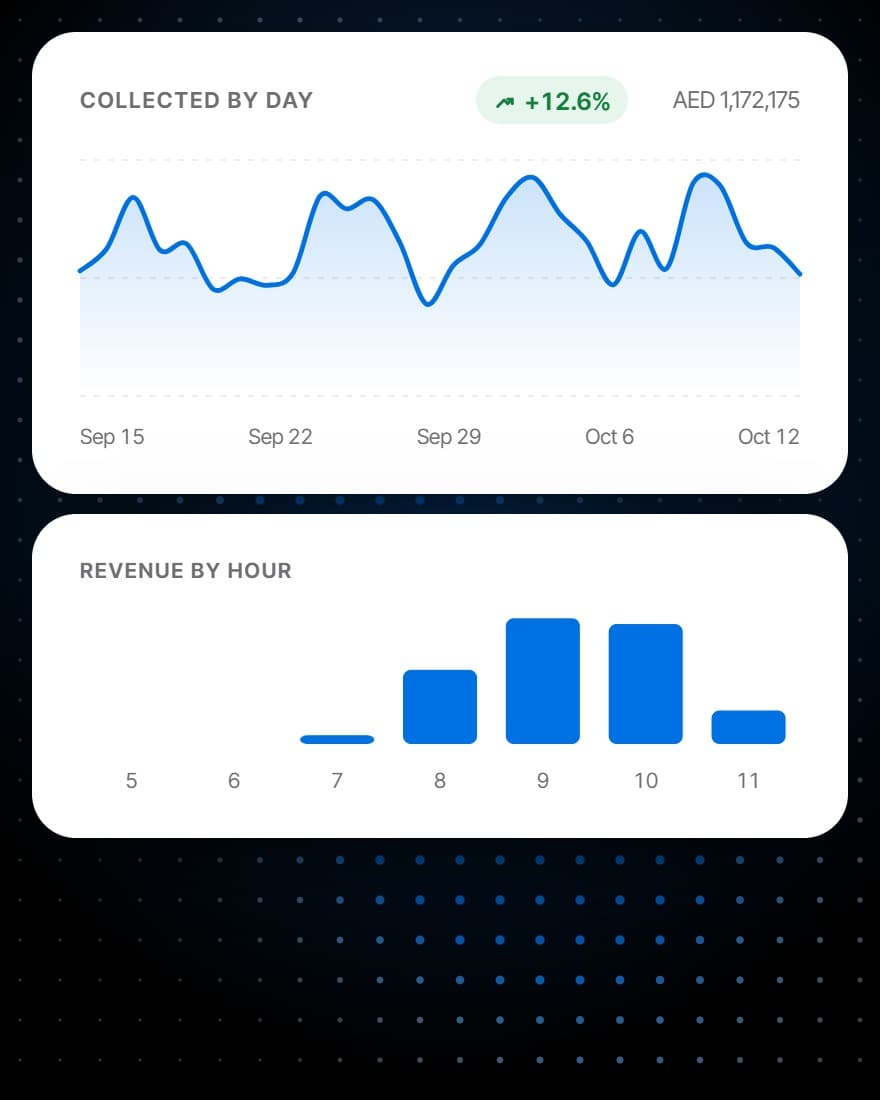
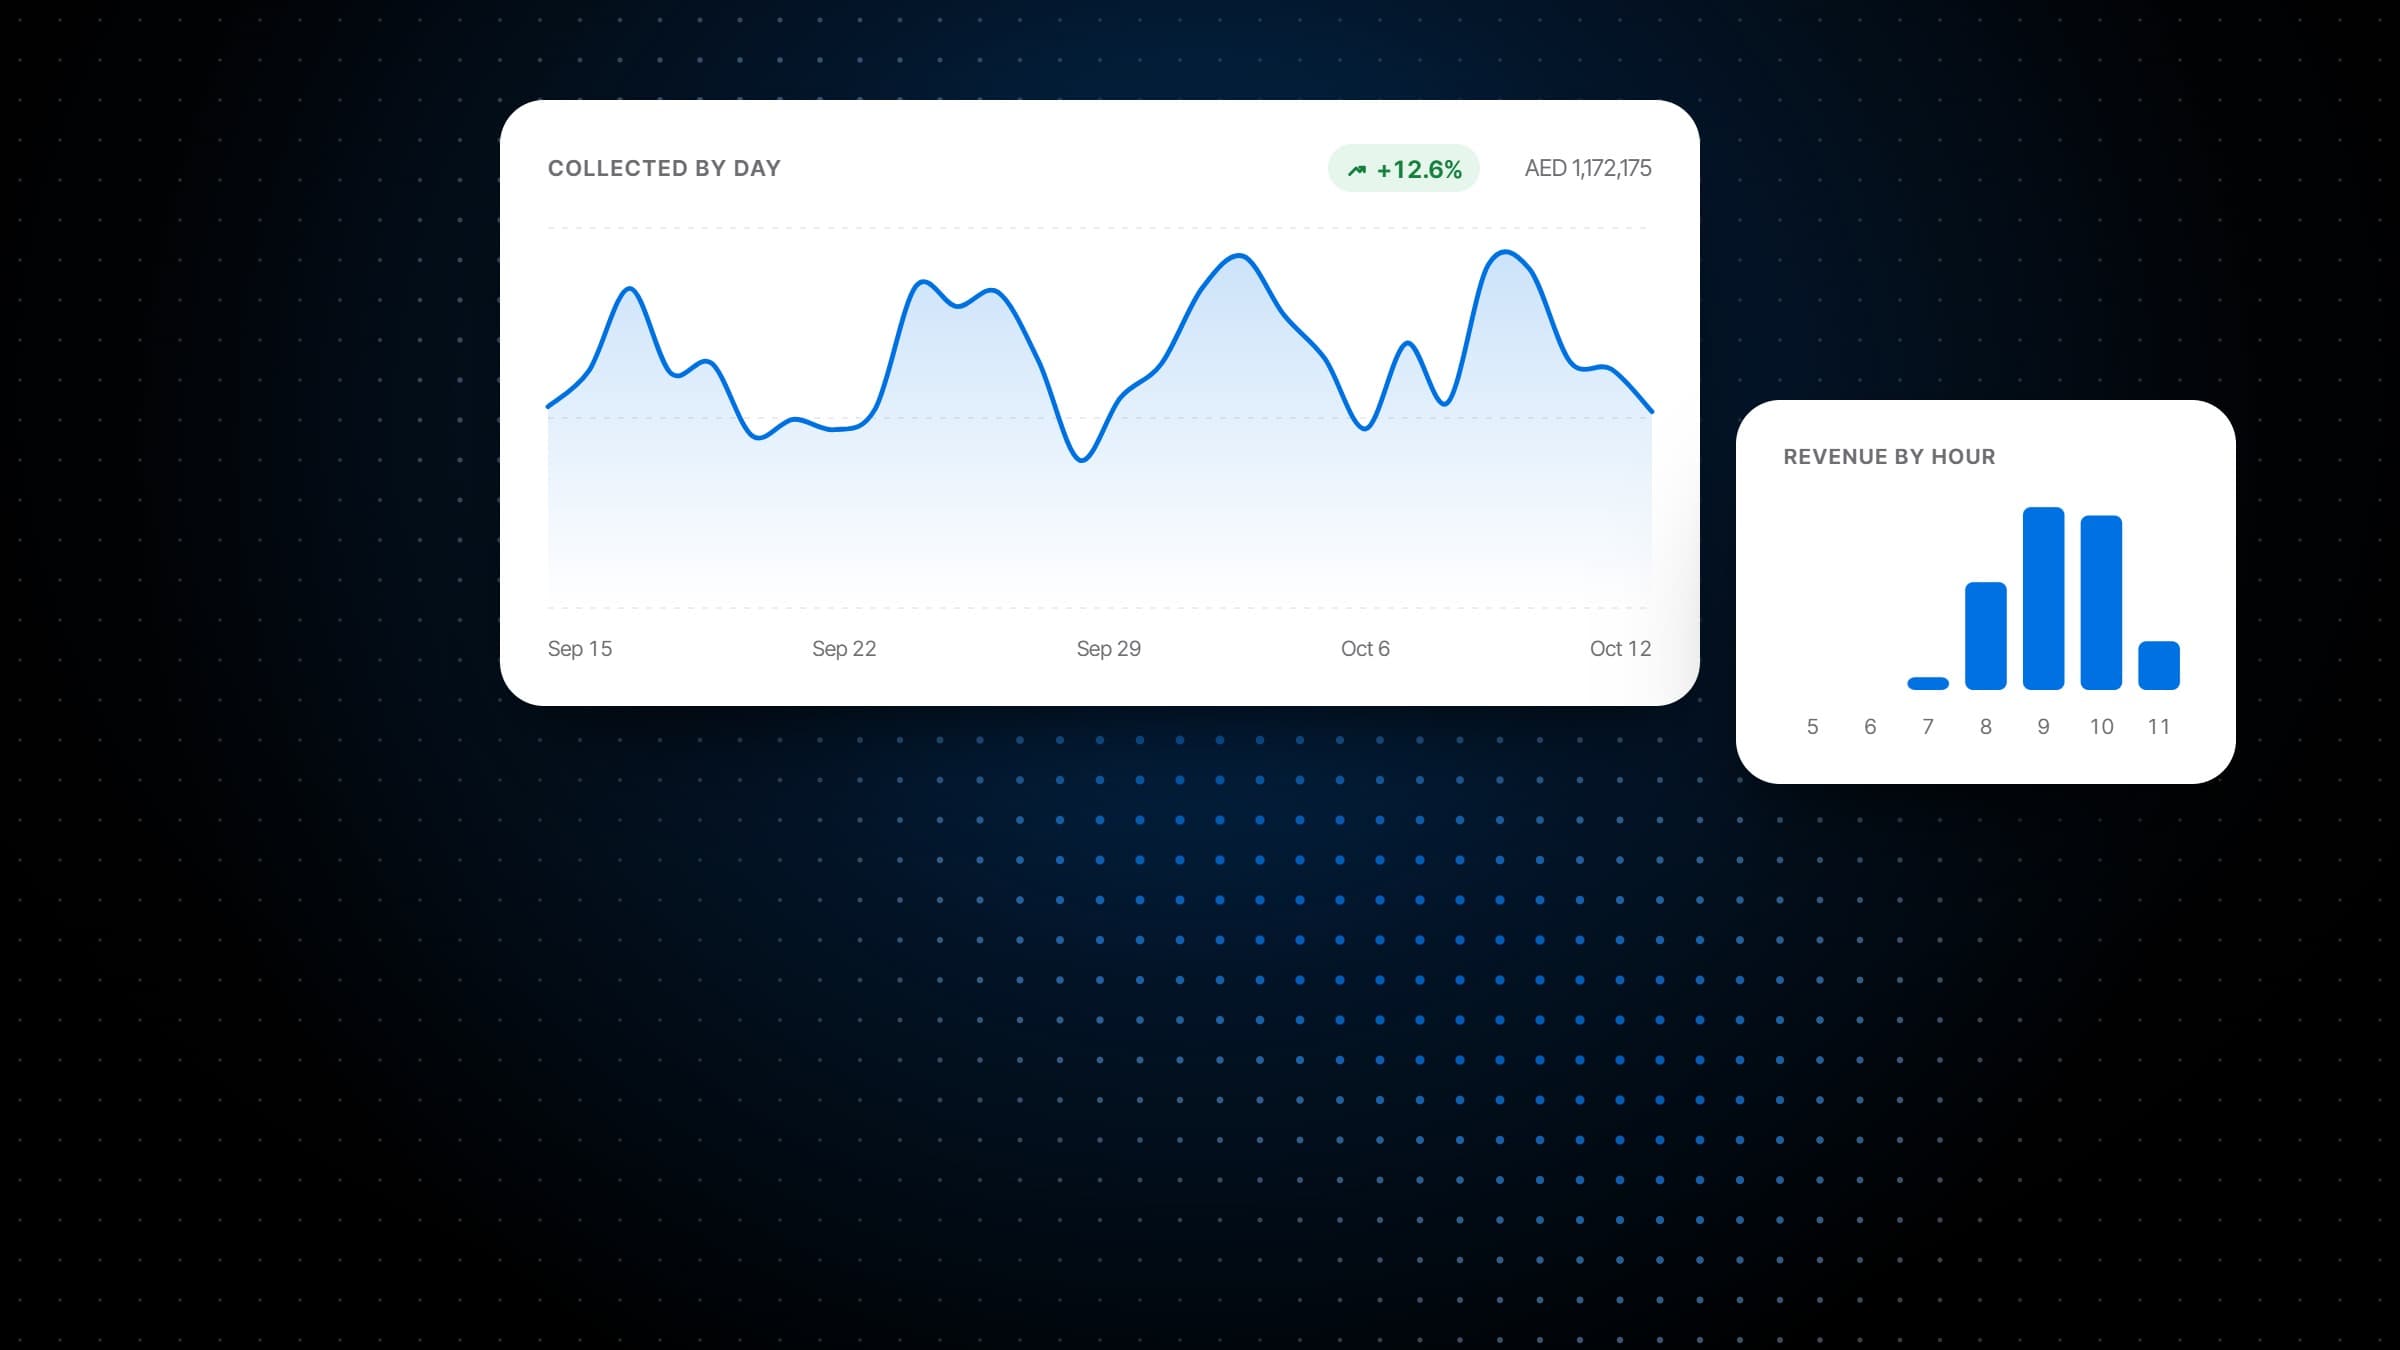
What was collected
What it does
Restaurant reporting that starts at the door.
Restaurant reporting for every part of the night: who booked and who came, how hard each table worked, what the kitchen took and what the till collected.
Seatings, covers and revenue for every table and zone, the median seating, revenue per seated hour and the minutes of service each table went unsold. The floor plan itself is shaded by whichever you choose, and the gap between seatings shows how quickly the room turns.
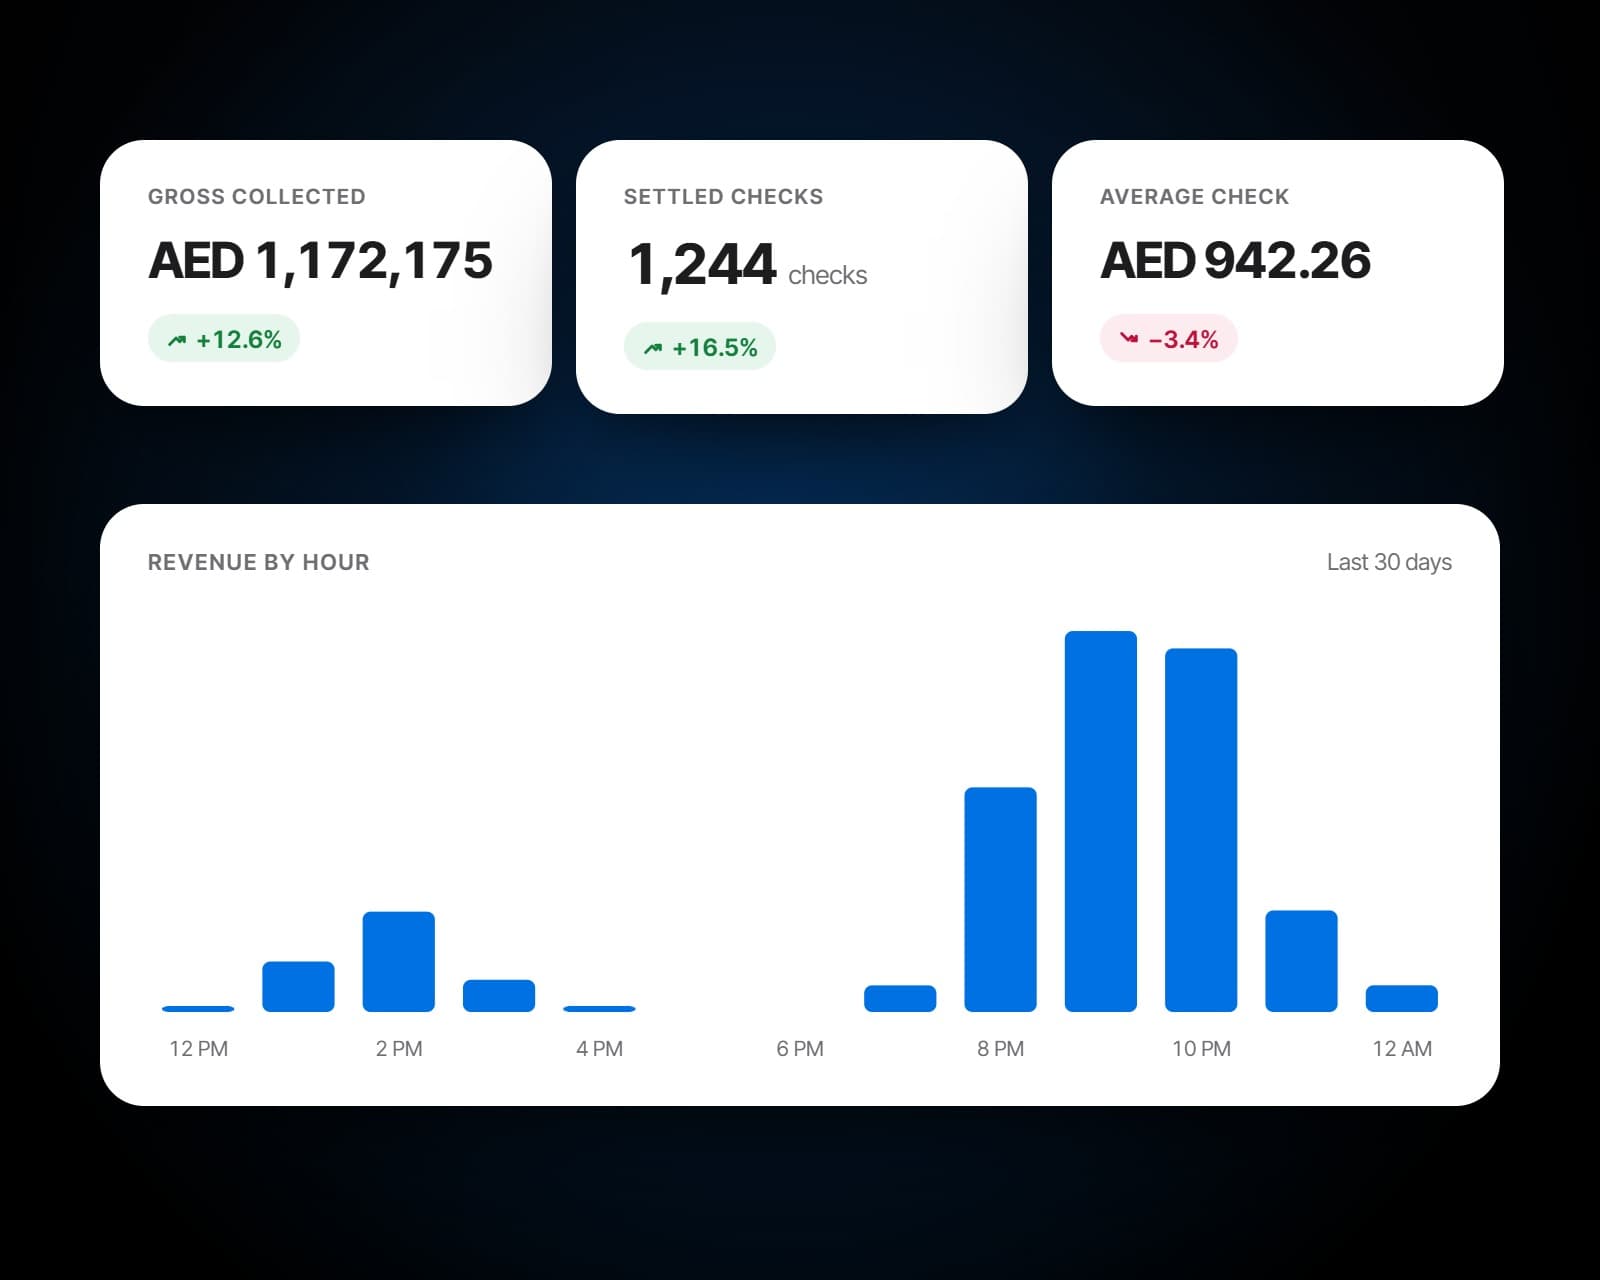
Checks opened, the average and median check, items per check and the void and comp rates, then what was collected: gross and net of discount, how it was tendered, revenue by hour, voids and comps by member of staff, and the tables that earned the most. Dishes ordered together are listed with how often they go together.
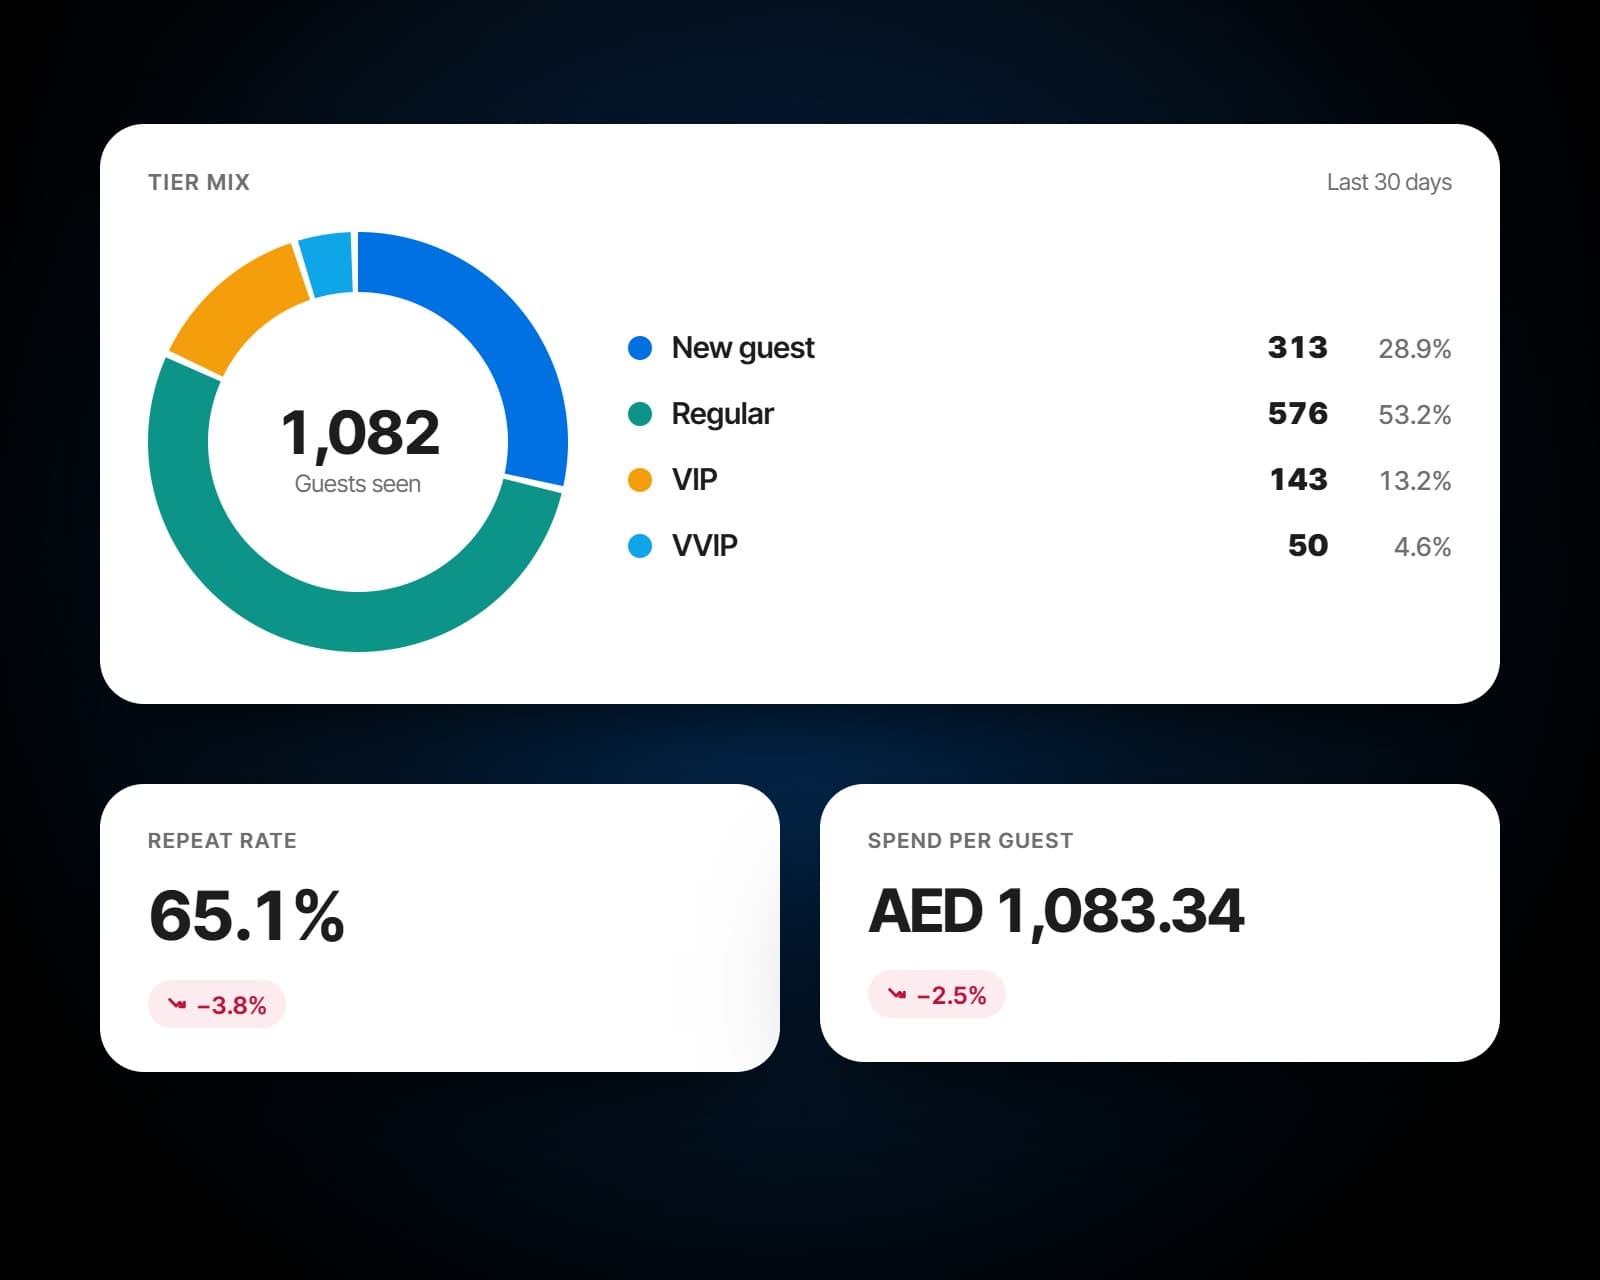
Guests seen, first visits and returns, the repeat rate and spend per guest, the mix of new, regular, VIP and VVIP guests, and the return rate by the week a guest first came. The best guests of all time are listed, and with Campaigns, the campaign report adds what each send did.
Before and after
The same Monday, already counted.
Reports built from the service itself, ready the morning after, with nothing to export.
A spreadsheet rebuilt every Monday from three exports that never quite agree.
Bookings, tables, the kitchen and the till read side by side, from the same records.
Covers from the booking system, revenue from the till and prep times from nobody.
Every figure against the period before, so a slow Friday is a fact or it is not.
A Friday that felt slow, and nothing to say whether it was.
Figures you can stand behind
Counted once, read honestly.
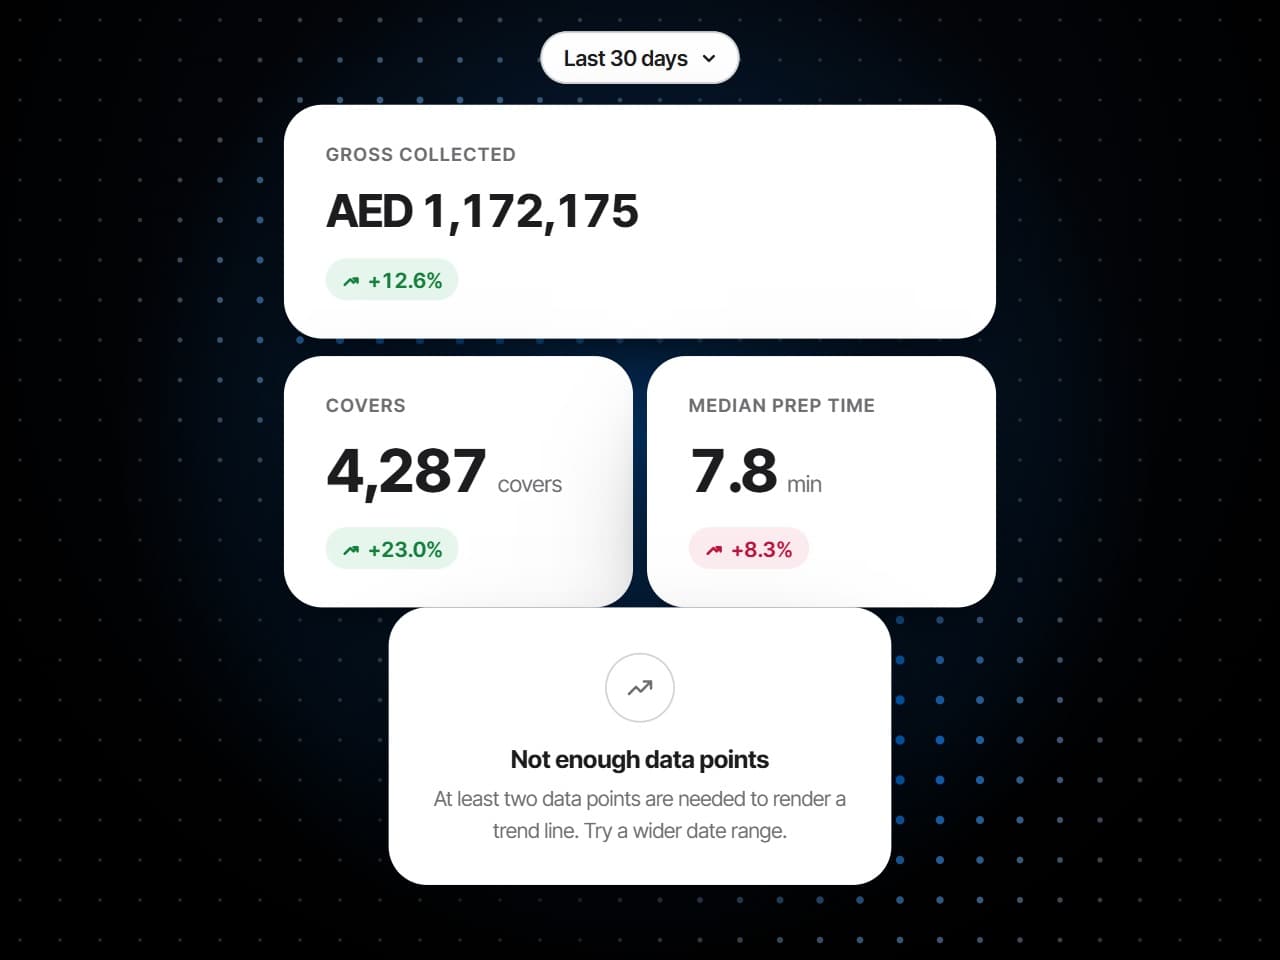
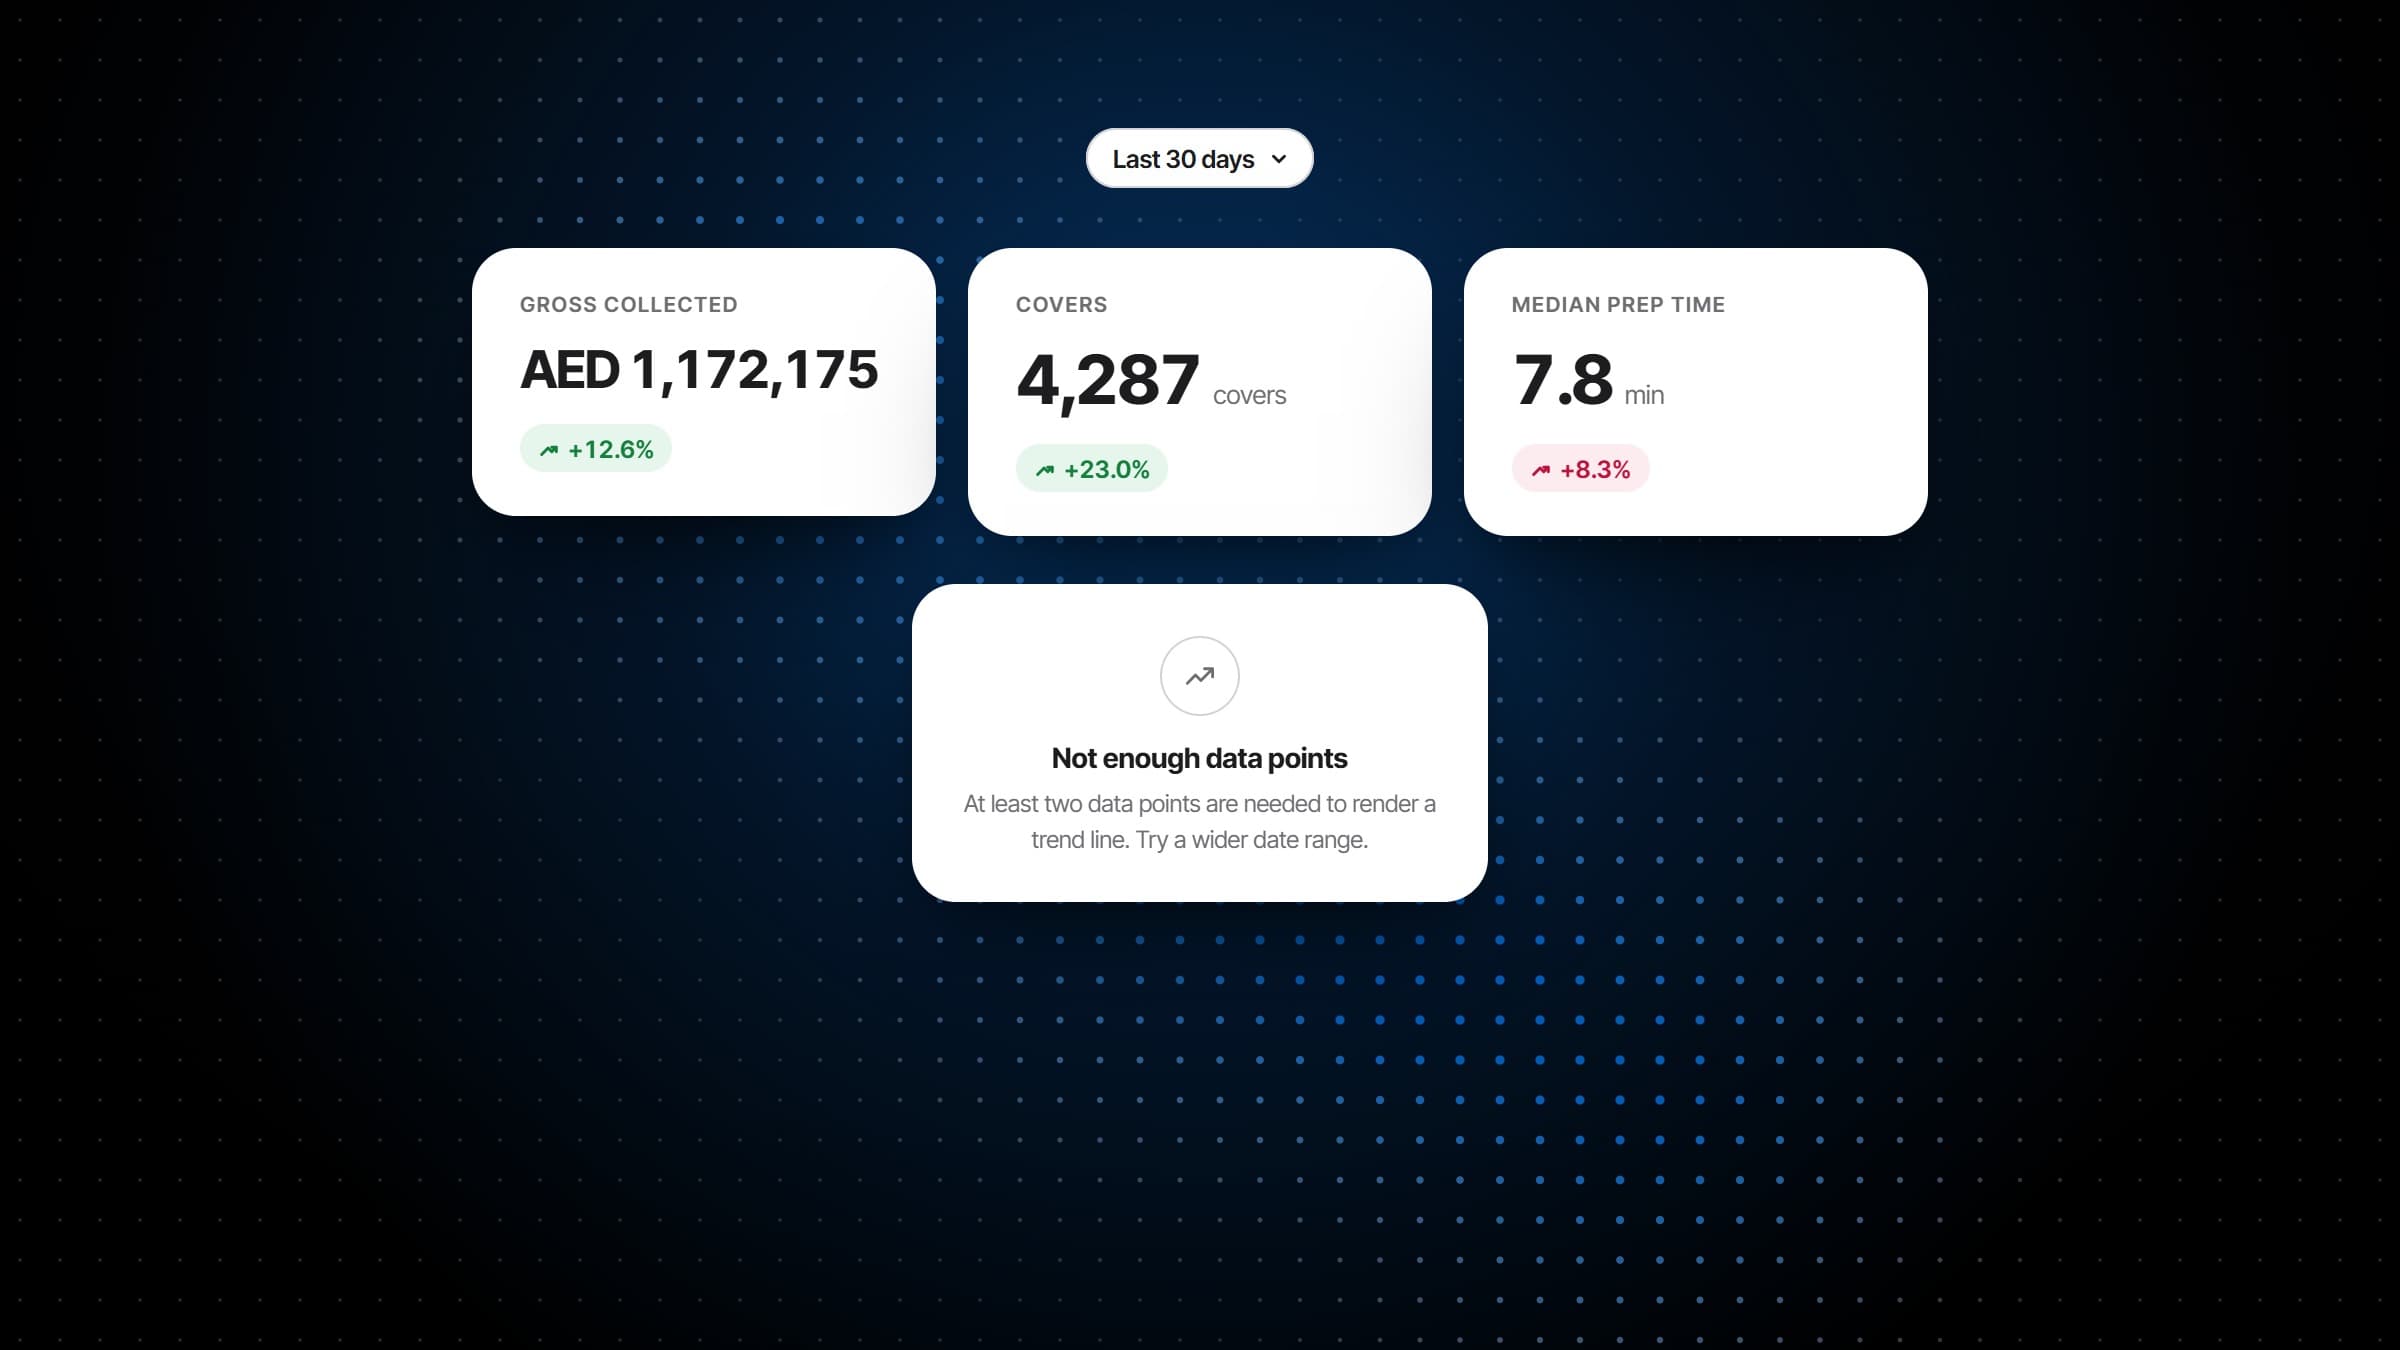
- On the venue's own clock
- Every figure against the period before
- Small samples flagged, not dressed up
- Nothing to import or export
Also included
And everything around the figures.
Any range you like
Today, yesterday, this week, the last 7 or 30 days, this month, last month, all time, or dates you pick.
The venue's own clock
Every day and hour is read on the venue's local time, wherever the person reading it is.
Small samples flagged
A figure built on too few records says so, and one too thin to mean anything is hidden.
Walk-ins in or out
Count walk-ins with the bookings, or read the booked covers on their own.
Filters that matter
Kitchen times by station, course and order type; bookings by meal period, source and party size.
Today, as it happens
Today's figures can be read during service, and say plainly that the day is still in progress.
Works with
Built on the service itself.
Every ticket and check
Order Fulfillment records each ticket's minutes and each check's payments, so the kitchen and payment reports are there from the first service.
More on Order FulfillmentCovers from the book
Bookings, walk-ins and seatings feed the reservation and table reports, down to the minutes each table went unsold.
More on Reservations & WaitlistThe menu report
Every dish that sold, with its units, revenue and margin, and how far guests get through the menu before they order.
More on MenusGuest CRM
One guest profile filled by every booking, order and check, with tiers, allergies and feedback on it.
More on Guest CRMCampaigns
Email campaigns to the guests who opted in, written to audiences your guest list already keeps, with consent and unsubscribes handled.
More on Campaigns
Plans
Which plan has Analytics?
Analytics is an add-on that builds on Order Fulfillment, and it comes with the plan that has everything.
Starter
For a venue that books tables and wants its menu on every phone.
$149per venue a month
- No Analytics
- Reservations & Waitlist
- Menus
Pro
Most venuesFor a venue that runs its whole service on servearound: ordering, kitchen and POS.
$249per venue a month
- No Analytics
- Reservations & Waitlist
- Menus
- Order Fulfillment
Premium
Everything, with the guest data and the marketing built on top of it.
$349per venue a month
- Reservations & Waitlist
- Menus
- Order Fulfillment
- Guest CRM
- Analytics
- Campaigns
Specs
Everything in Analytics.
Reservations
- Covers and bookings
- No-show, cancellation and seated rates
- Median lead time
- By meal period, source and party size
- Covers by day and hour
Tables
- Seatings, covers and table revenue
- Utilisation and median seating
- Revenue per seated hour
- The floor plan shaded by any of them
- By zone, and the gap between seatings
Orders and payments
- Average and median check, items per check
- Void, comp and remake rates
- Dishes ordered together
- Gross collected and net of discount
- How it was tendered, and revenue by hour
- Voids and comps by member of staff
Kitchen
- Median and P90 prep time
- Queue and pass time
- On-time rate against your target
- By station, course and order type
- The dishes that cost the most time
Menus and guests
- Menu revenue, units sold and gross margin
- How far a visit gets through the menu
- Repeat rate and spend per guest
- Tier mix and return rate by first week
- The best guests of all time
Every report
- Ranges from today to all time, or your own dates
- Compared with the period before
- A day-by-day trend and a heatmap of days and hours
- The venue's own clock
- Small samples flagged or hidden
Frequently asked questions
What is restaurant analytics software?
Software that turns a restaurant's own records, its bookings, tables, orders, tickets and payments, into reports about how the service ran. servearound's restaurant analytics software reads them where they are made, so there is nothing to export, and every figure is set against the period before it.
Where do the numbers come from?
From the service itself: the bookings and seatings, the checks and their payments, and every kitchen ticket's minutes. Nothing is typed in or imported, so the reports agree with what happened on the floor.
Which reports are there?
Eight: reservations, tables, orders, kitchen, payments, menus, guests and campaigns. Each has its headline figures, a day-by-day trend, a heatmap of days and hours, and the breakdowns that belong to it.
Can we compare with last week or last month?
Every figure is shown against the period before the range you pick, whether that is a day, a week, a month or dates of your own, with whether it went up or down and whether that is good.
Whose clock are the days and hours on?
The venue's. A busy Friday at nine is a Friday at nine where the restaurant is, whoever is reading the report and wherever they are.
What does table utilisation measure?
How much of each table's service time was sold. The report shows every table's seatings, covers and revenue, its median seating, its revenue per seated hour and the minutes it went unsold, and shades the floor plan by any of them.
How are prep times measured?
From the tickets. Each one records when it landed, when it was started and when it was called away, so the report splits a ticket's time into the queue, the prep and the pass, by station and by hour, against the on-time target you set.
Can we see the no-show rate by channel?
Yes. The reservation report breaks bookings down by where they came from, by meal period and by party size, each with its no-show and cancellation rates.
Is it for one venue or the whole group?
Reports are read for one venue at a time, on that venue's clock. Pick another venue and the same reports open for it.
What if there is too little data?
The report says so. A figure built on a small sample is marked to be read with care, and one that needs more records before it means anything is hidden until it has them.
Do we need Order Fulfillment for Analytics?
Yes. Analytics builds on what Order Fulfillment records, the tickets, checks and payments, so it is added on top of it, and it comes with the plan that has everything.